portfolio website

My personal website for Data Analytics and Data Science projects.

September 15, 2022

Load Shedding in South Africa

The Worst power cuts ever, are renewable energy sources an answer?

Books

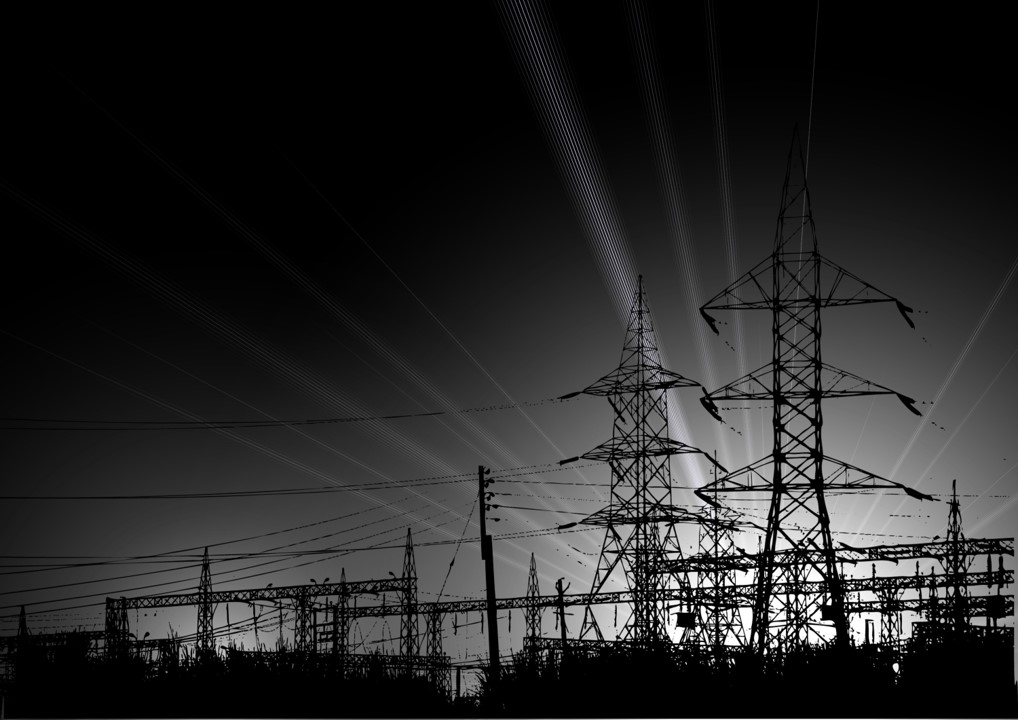
If you are from South Africa, you are well aware of Regular power cuts that we experience almost everyday. Eskom, which is a South African public utility company resorts to power cuts whenever there is insufficient generation capacity to meet energy demands. The main reason for insufficient generation capacity is aging coal fired power stations which are prone to breakdowns.
I did an exploratory data analysis using R to determine how bad things have deteriorated over the past five years and whether there is any increase in capacity installation of renewable energy sources. You can follow this story on Medium by clicking here. Click the link below to view the project analysis on Kaggle

August 23, 2022

Fatal Police Shootings in the US

I created a dashboard on Tableau as part of a competition from Data in Motion. The dashboard shows the gruesome killings of US citizens by US police. The data shows that each year, about 1 000 people are fatally shot by police in the US. Victims as young as two years are part of the statistics. In total 7 649 people have been killed from 2015 to Date. You can find the latest data from The Washington Post. Click the link below to view the Dashboard on Tableau.

August 16, 2022

Fictional Book Store

Web Scraping using Beautiful Soup

Books

I recently started a reading challenge; by the end of this year I want to have read at least 5 books. Choosing the next book can be daunting. I don't want to buy a book only to find out that it is bad. I want to know the reviews of the book, its cost and the place to buy it.
I want this process to be easy though, I don't want to browse the whole internet searching for books. To make things easy, I used Python to scrap a fictional book store. The website had 1000 books, divided into different categories. These books had different reviews, prices and stock available.
In a few minutes, the program scraped the entrie website and saved the results on a csv file. This dataset can be found on Kaggle.
With a few clicks on a spreadsheet, I can sort the data and find exactly what I am looking for. Or I can do more advance stuff like inventory management if I was working for the bookstore or identification of books with low or high sales. Click the link below to see the code on Github.

August 08, 2022

Factors affecting the price of diamonds

diamod.png

Diamonds are minerals composed of carbon. They are the hardest naturally occuring substance known to men. Because of their extreme hardness, diamonds have diverse industrial applications. They are also used for making jewellery, which is something we are all familiar with.
We all know that diamonds are expensive, but do we really know why? To find out, I did an exploratory data analysis whereby a dataset sourced from kaggle was used. The dataset contained nearly 54 000 round cut diamonds and their corresponding prices for the year 2022.
For an easy read, click here to follow this story on Medium publication. You can follow the analysis on kaggle by clicking the link below. I used R Programming language to do data cleaning, data analysis as well as data visualisations.